Month: March 2024
GRACOMICS
GRACOMICS : A Graphical Comparison of Multiple results with Omics data
1. Introduction
GRACOMICS is a visualization program to view a set of multiple graphical results at a glance. Recent omics data have extremely a large number of parameters while having a small set of samples, this is also known as NP-problem and running an analysis with such data will return numerous amounts of results in p-dimensions. Additionally, comparing these results may not be simple as many different analysis-specific results are produced. Consequently, the use of computer languages can’t be avoided when performing such analyses. For example, R (reference) can be used to import data, analyze, and visualize certain data, but comparing of those visualized results still remains a problem. In case the user is computer language friendly, such problem can be solved using R. TM4 (reference) is another program for omics data analysis that uses Graphic User interface (GUI) that ease the burden of programming skills yet, still do not provide a good comparison of multiple results. The main hardship in comparing multiple results is that the results are solely dependent on the user-defined values such as the significant-level. However, GRACOMICS solves such problem; it provides a full comparison of multiple results, and is a GUI based program even a novice in computer programmer can use.
GRACOMICS is composed of 3 modules: Pairwise Correlation Plot to compare two results, Pairwise Interactive Plot to summarize the differences between two results more precisely with a click of a mouse, and Multiple Result Heat Map to compare two or more results comprehensively. Each module is expressed differently, yet can be used to provide mutual supplementation for each other. Especially, as a standalone program, GRACOMICS is a powerful tool that guides novice programmers to effectively compare several analysis results with ease. GRACOMICS is a GUI-based program written in Java for cross-platform computing environment. GRACOMICS can be applied to compare the analysis results for any kind of large scale omics data.
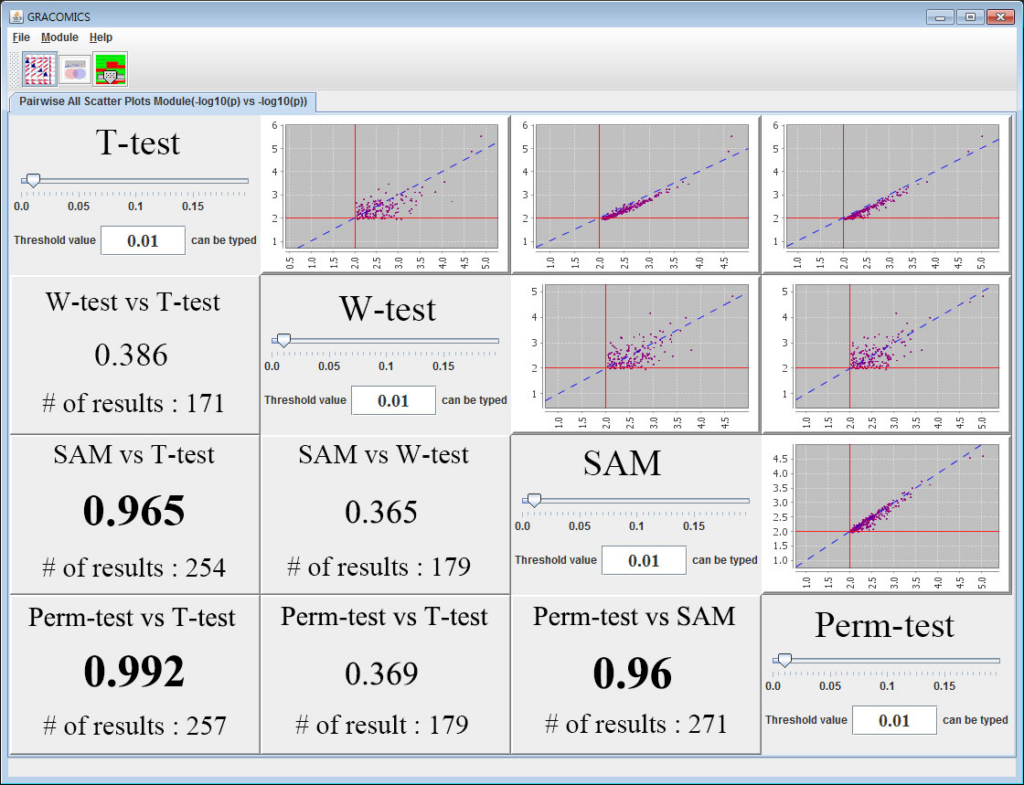
Figure 1: Pairwise All Scatter Plots Module (Pair-ASP)

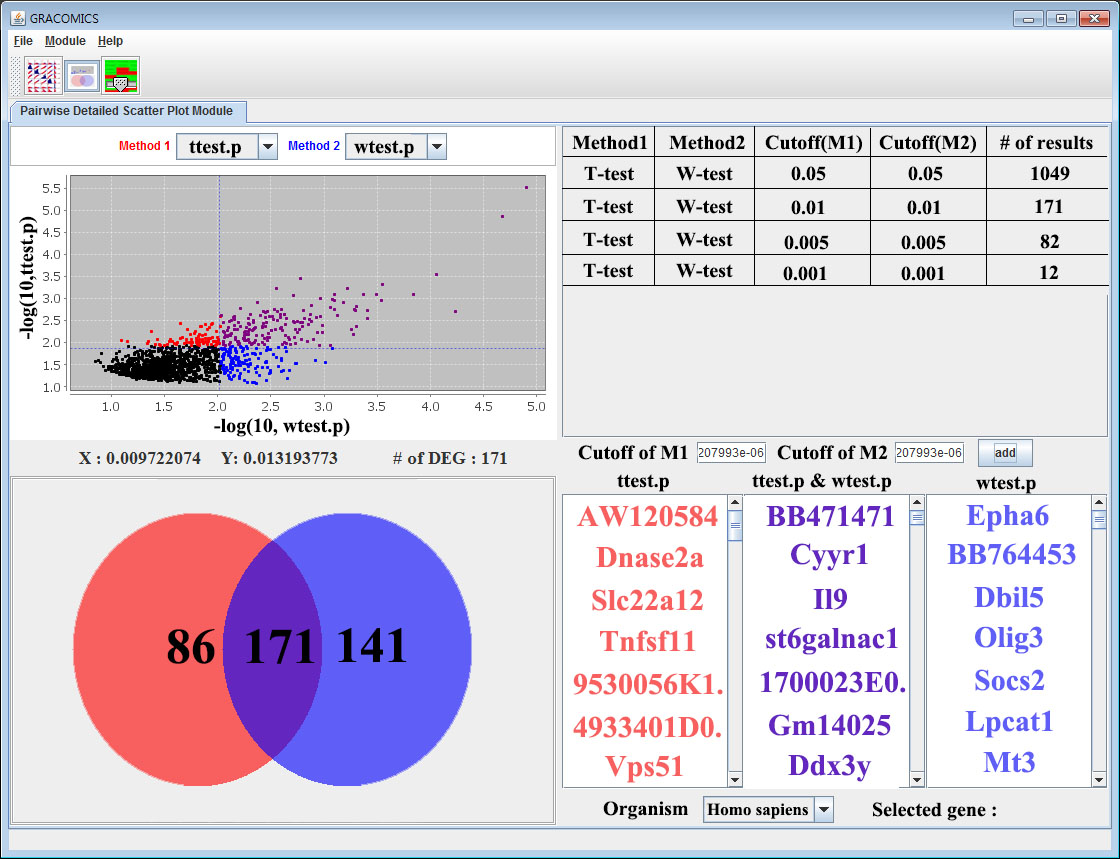
Figure 2: Pairwise Detailed Scatter Plot Module (Pair-DSP)
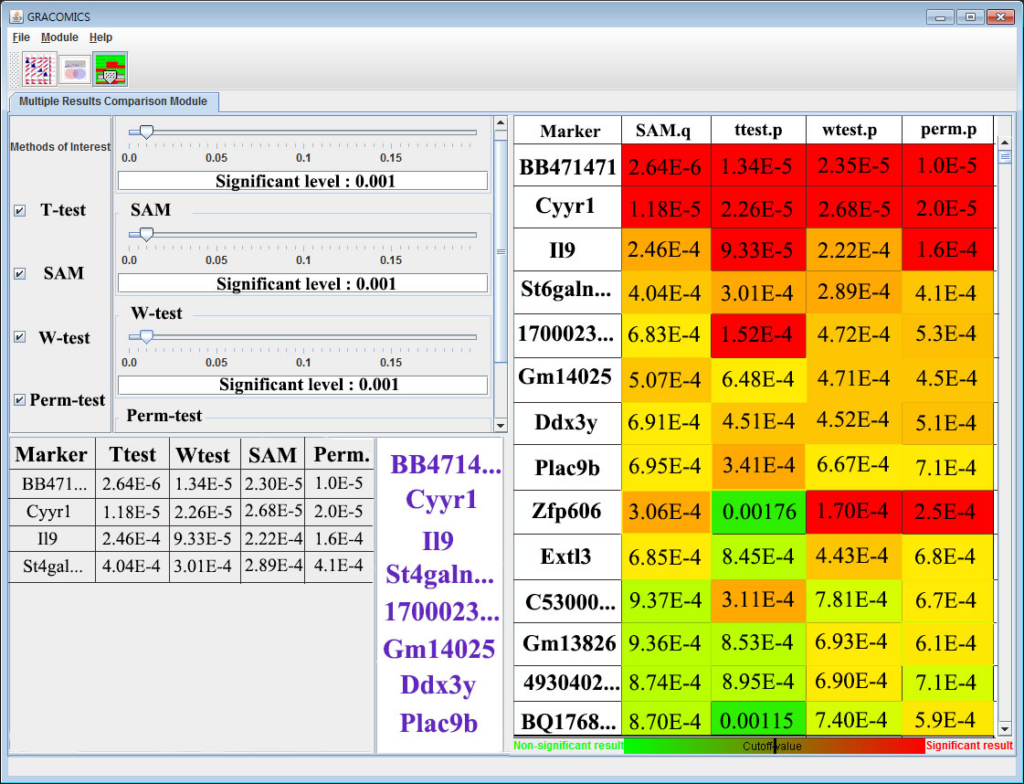
Figure 3: Multiple Results Comparison Module (Multi-RC)
2. Installation
More detailed information is included in the Manual. [ PDF version / Web version ]
Please follow these steps.
1. You can directly download the executable java file(.jar) from the following link:
Download the GRACOMICS (.zip) file
2. If you have not installed the java launcher, please download the java launcher from the following link:
JRE (launcher for .jar files)
3. If your OS support the GUI, double click the gracomics.jar, else please input the following command :
Java -jar gracomp.jar4. When gracomics.jar does not execute in windows, please download and excute the jar-enviroment fixed file following link: Download the jarfix (.exe) file
Also, please check the location of GRACOMICS.JAR
If GRACOMICS.JAR path includes special letters, please move the file to another path without special letters (i.e. c:\Mr SMITH or c:\Mr_SMITH => c:\MrSMITH)
3. Examples
GRACOMICS can import tab-separated values(TSV) datasets (same as the attached dataset) which are tabular type.
More detalied information is included in the manual.
GRACOMICS has been successfully applied to compare various statistical tests for many omics data such as microarray and SNP data including Welcome Trust Case Control Consortium (WTCCC).
You can get the two dataset to input the GRACOMICS from following link :
(1) Microarray dataset : The test results to analysis of GSE27567 data: Download the dataset
(2) SNP dataset : The test results to analysis of WTCCC data: Download the dataset
nomogramIPMN

pathome
ENPP
ENPP is an algorithm that reduces permutation times via pruning of insignificant markers, when the markers satisfy pre-defined pruning conditions. Consequently, it can obtain significant markers in a feasible time, even for data sets with large numbers of features such as GWAS SNP data sets.
Detailed algorithm is described in the below original article, “Enhanced Permutation Tests via Multiple Pruning, Front Genet. 2020 Jun 25;11:509. doi: 10.3389/fgene.2020.00509.”
Download
An example R script is linked to: here
QTest
Introduction
This website provides R source files for implementation of the numerical study in the manuscript that will be presented in ECCB 2016, titled “Gene-Set Association Test for Next-Generation Sequencing Data.”.
Usage
The following source codes are included:
QTest_code.R.R —— List all functions needed.
n.log10.minp.1e09.txt —– Background distribution of Q-Test statistic. This file is required to execute Q-Test, and should be placed in the same directory with R code or your working directory of R.
For detail, please see the R codes.
Download
You can download a zipped file contains source codes here:
LPEseq
LPEseq: Local-pooled-error test for RNA Sequencing experiments with a small number of replicates
– Version: Release (0.01)
– Written in R script (R-2.15)
– No package dependencyEstimate gene-specific variance specially when no replicate RNA-Seq data is available and test for differential expression based on local pooled error.
Author:
Jungsoo Gim <jgim80@snu.ac.kr>
Sungho Won <won1@snu.ac.kr>
Taesung Park <tspark@stats.snu.ac.kr>
Maintainer: Jungsoo Gim <jgim80@snu.ac.kr>
Any comments will be welcome.
To install this package, start R and enter:
> source(“http://bibs.snu.ac.kr/software/LPEseq/LPEseq.R”)
> install.packages(“LPEseq_version.tar.gz”, repos=NULL, type=”source”))
Documentation
LPEseq manuscript LPEseq manuscript including detailed methods
LPEseq supplementary LPEseq online supplementary
source manual Description of functions included in “LPEseq” package
usage manual Exercise with an example script
Download
LPEseq R package-the lastest version
Citation:
Jungsoo Gim, Sungho Won, Taesung Park, (2016) PLoS ONE
cLPDseq
——————————————————————————————————————————-———————
CONDITIONAL ESTIMATION OF LOCAL POOLED DISPERSION PARAMETER IN SMALL-SAMPLE RNA-SEQ DATA IMPROVES DIFFERENTIAL EXPRESSION TEST
– Version: Release (0.01)
– Written in R script
– Package dependency: edgeRA method for differential analysis of count data, using conditional estimation of local-pooled dispersion parameters.
Author:
Jungsoo Gim <jgim80@snu.ac.kr>
Sungho Won <won1@snu.ac.kr>
Taesung Park <tspark@stats.snu.ac.kr>
Maintainer: Jungsoo Gim <jgim80@snu.ac.kr>
Any comments will be welcome.
——————————————————————————————————————————-———————
INTRODUCTION
cLPDseq is based on edgeR. To use cLPDseq functions for differential expression analysis, edgeR package should be first installed.
> install.packages(“edgeR”)
> library(edgeR)
Once edgeR is installed, you can use cLPDseq functions by downloading it from the link below, or by directly typing
> source(“http://statgen.snu.ac.kr/software/cLPDseq/cLPDseq.R”)
Followings are a typical example of DE analysis using edgeR (please see the edgeR manual for further details)
> counts <- matrix(rnbinom(1000, mu=runif(10, 1, 1000), size=0.1), ncol=4)
> group <- factor(c(1,1,2,2))
> dge <- DGEList(counts=counts, group=group)
> dge <- calcNormFactors(dge)
> dge <- estimateCommonDisp(dge)
> dge <- estimateTagwiseDisp(dge)
> res <- exactTest(dge)
> res <- topTags(res)
Since the cLPDseq functions take the DGEList object, one can easily evaluate the local-pooled dispersion by typing,
> dge <- estimatePooledDisp
Note that estimatePooledDisp() is the cLPDseq function evaluating local pooled dispersion descripbed in our manuscript. Thus, the cLPEseq R script (cLPDseq.R) should have been read to perform the analysis.
cLPDseq.R script overwrites exactTest() to incorporate pooled dispersion into DEG test. The exact test for cLPDseq can be conducted by giving a proper argument,
> rescLPD <- exactTest(dge, dispersion=”lpd”)
See and compare p-values obtained by original edgeR method and cLPD method
> pvals <- cbind(red$table[,3], rescLPD$table[,3])
> plot(pvals, xlab=”edgeR”, ylab=”cLPDseq”)
——————————————————————————————————————————-———————
Download
cLPDseq manuscript Published cLPDseq manuscript
source code A script file including functions evaluating conditional local pooled dispersion (cLPD) and DEG testing upon cLPD
——————————————————————————————————————————-———————
Citation:
Jungsoo Gim, Sungho Won, Taesung Park (2016) CONDITIONAL ESTIMATION OF LOCAL POOLED DISPERSION PARAMETER IN SMALL-SAMPLE RNA-SEQ DATA IMPROVES DIFFERENTIAL EXPRESSION TEST, Journal of Bioinformatics and Computational Biology, accepted
FARVATX
WISARD

WISARD (Workbench for Integrated Superfast Association study with Related Data) is a free and comprehensive Statistical Analysis toolkit for omics data.
Large-scale SNP, CNV and NGS data with related and unrelated samples can be analyzed with WISARD in computationally optimized and efficient way by using muti-core system.