ˇá GRACOMICS manual ˇá
1. System requirements
GRACOMICS will run on any machine that has a recent version of Java. This version of GRACOMICS requires Java 1.7.0_45 at least. Most of the development has been done using JDK v1.6 and some of the more advanced features require Java 1.7.0_45 or higher. See the Installation section for details on how to get Java.
If you have not installed the java launcher, please download the java launcher from the following link:
2. Installation
GRACOMICS is a java based program, and is distributed in *.jar form.
The software is provided on the GRACOMICS homepage, and as a side note, JAVA launcher called JRE is an essential program that is needed to run GRACOMICS.
The most up to date version of GRACOMICS is always available from the GRACOMICS web pages.
Also, you can directly download the executable java file(.jar) from the following link
To execute the GRACOMICS, you must register the following path: [jre-setup-folder]/bin.
If Java is successfully installed on the computer, following message will be on the screen.

It is possible to directly execute gracomics from the jar file.
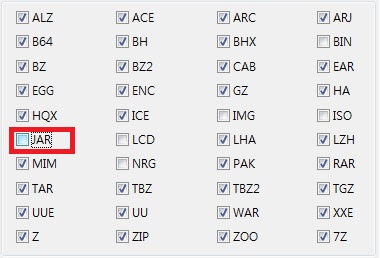
If the user computer is installed with compressor such as Winzip, alzip, RAR and so on, sometime gracomics.jar file consider compressor file.
In that case, you must uncheck the (.jar file extension) in the compressor program.
3. Example dataset
You can get the two example dataset to input the GRACOIMICS from following link :
(1) Microarray dataset : The test results to analysis of GSE27567 data
(2) SNP dataset : The test results to analysis of WTCCC data
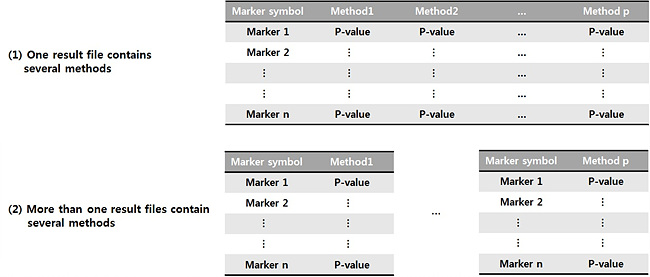
GRACOMICS can import tab-separated values (TSV) datasets (same as the attached dataset) which are tabular type and have the following structure
4. Loading dataset & prescreening or selecting methods
Following screen pops up when GRACOMICS is executed.
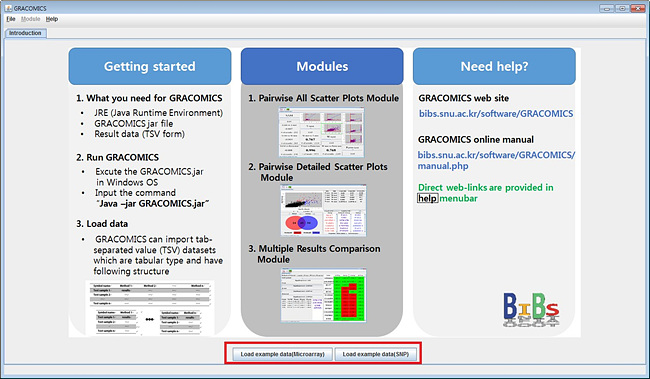
This is the main page of the program which provides the total scheme of the program.
GRACOMICS provides links to its given example datasets, by default, for tutorial purposes.
General applicants can open files using the [File] -> [open] option on the menu bar (up top).
The files can be opened through the dialog box; the TSV files can have multiple methods or
several files with single methods as shown in 3.1.
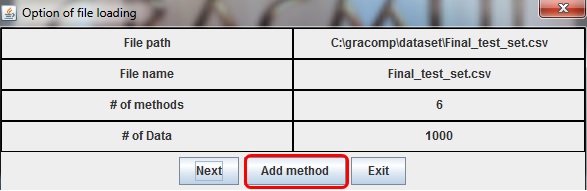
When the file is opened, new dialog box with a detailed description of the files will appear.
[Add method] button, highlighted in red on the above picture, can be used to import more files.
Press next if all methods are imported.
ˇŘ It is improtant that order of the identifier should be same such as gene symbol, and SNP ID.
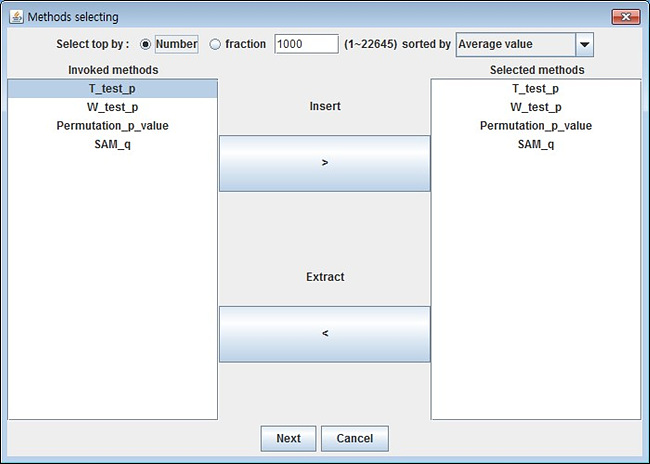
In the method selection dialog, the user can select from the invoked pool of methods by shading the methods and pressing the insert button.
Also, the user may change the number of input data (preferably fewer than 5000 top selection for smooth interactive nature of GRACOMICS).
Usually in microarray data analysis, only a minority of the SNP data is selected; justifying 5000 is enough.
Such process is called pre-screening; GRACOMICS provides top selection by average of all inputs and top selection via selected methods.
As shown in the top panel, top markers can be chosen by number or fraction;
furthermore, these input-values can be sorted in various ways via comb-box, for a less constrained pre-screening process.
In the method selection dialog, the user can select from the invoked pool of methods by shading the methods (clicking the methods while pressing the left CTRL on the keyboard) and pressing the insert button in blue.
Also, the user may change the number of input data (preferably fewer than 3000 top selection for smooth interactive nature of GRACOMICS).
Usually in microarray data analysis, only a minority of the SNP data is selected; justifying 5000 is enough.
Such process is called pre-screening; GRACOMICS provides top selection by average of all inputs and top selection via selected methods.
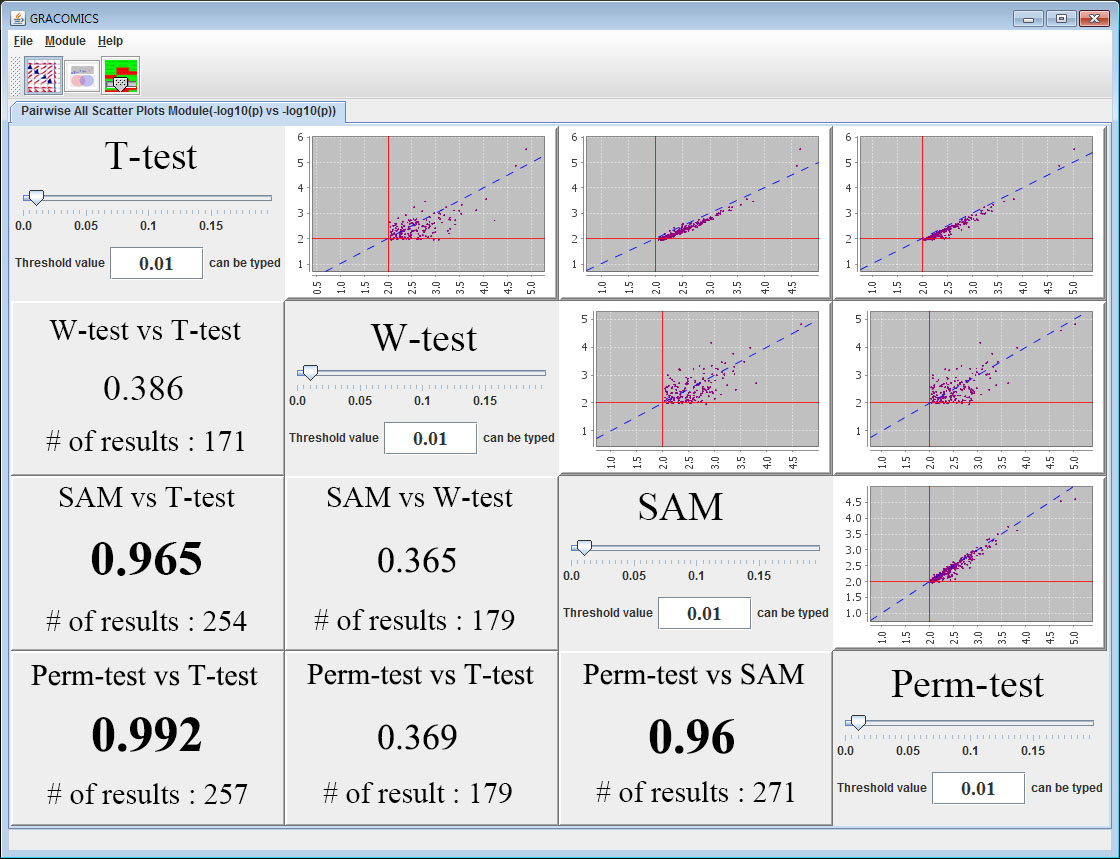
5. Pairwise All Scatter Plots Module (Pair-ASP)
If all the files and methods are selected, we can observe the Pairwise Correlation Plot in the first module. This table provides correlation information of each method versus another in -log10 scale. Orthogonal panels contain their name of the method and a slide bar to control user defined value. Pair-ASP can provide interactive change in the scatter plots with simple dragging of the slide bar to desired user-defined value. On the panels south-western to the orthogonal panels, names of compared methods and the correlation-coefficient of the two methods are provided. Pair-ASP provides the correlation information of the input-methods and the significant results at a given user-defined value, the best part is, that it is interactive and global in a sense. To get more detailed view of the analyzed results, the user can use the Pairwise Detailed Scatter Plot Module (Pair-DSP) module either by clicking the button indicated in red or by clicking the plot.
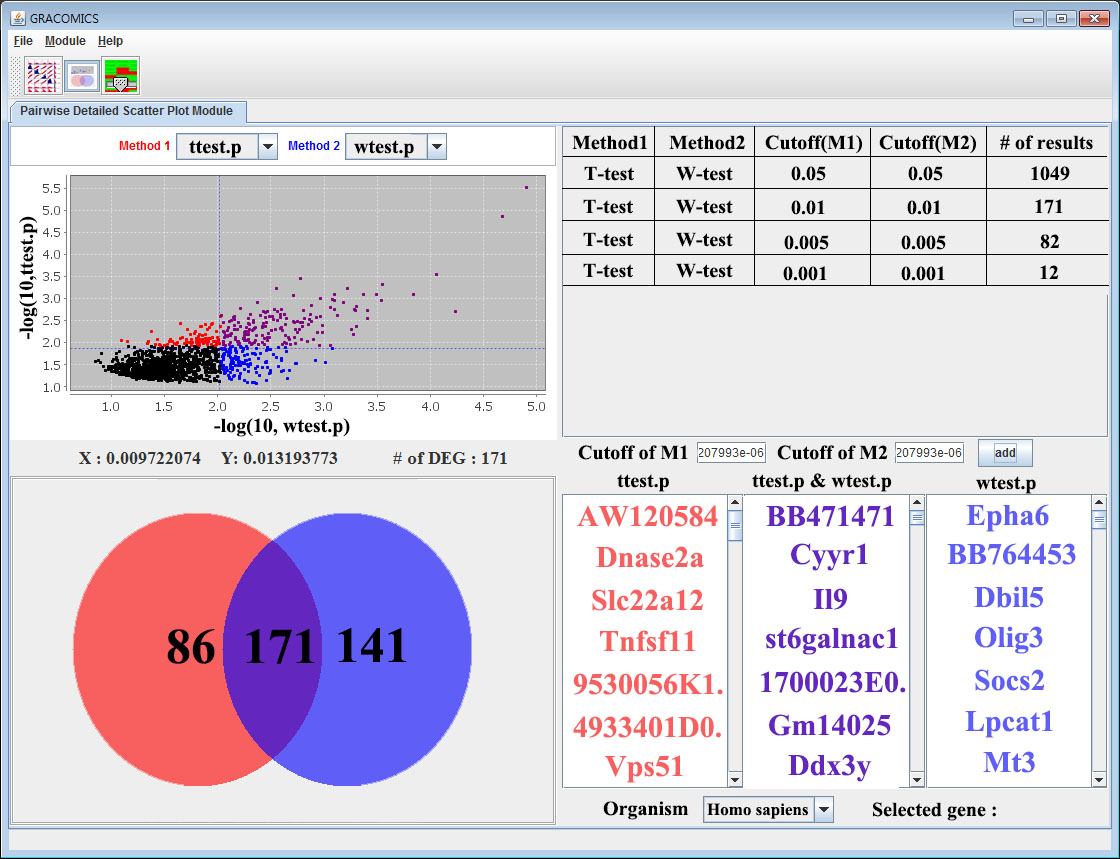
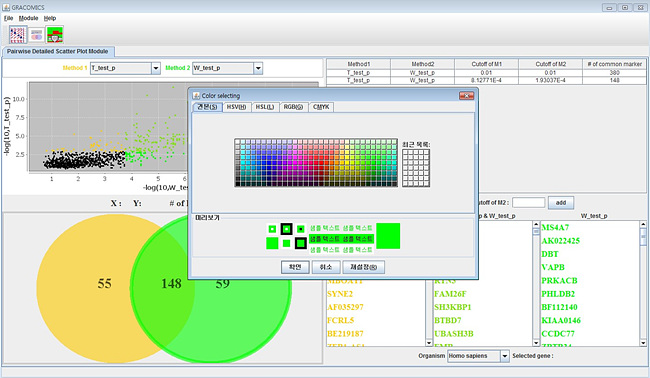
6. Pairwise Detailed Scatter Plot Module (Pair-DSP)
By entering Pair-DSP using any of the two ways stated above, screen similar to following figure will pop up. Pair-DSP provides much more zoomed in scatter plot and select out the significant results much more easily. Using simple mouse events on the scatter plot, the user can manipulate the cutoffs which changes the resulting table and plots. Venn diagram on the left and the table on the right summarize the results and present to the user in an organized manner. For microarray data analysis, the list would contain the symbols of the significant genes on the table, and show the corresponding Venn diagram on the left. As seen in figure 5 and 6 the methods are color defined, the user can change the color that soothes users taste.
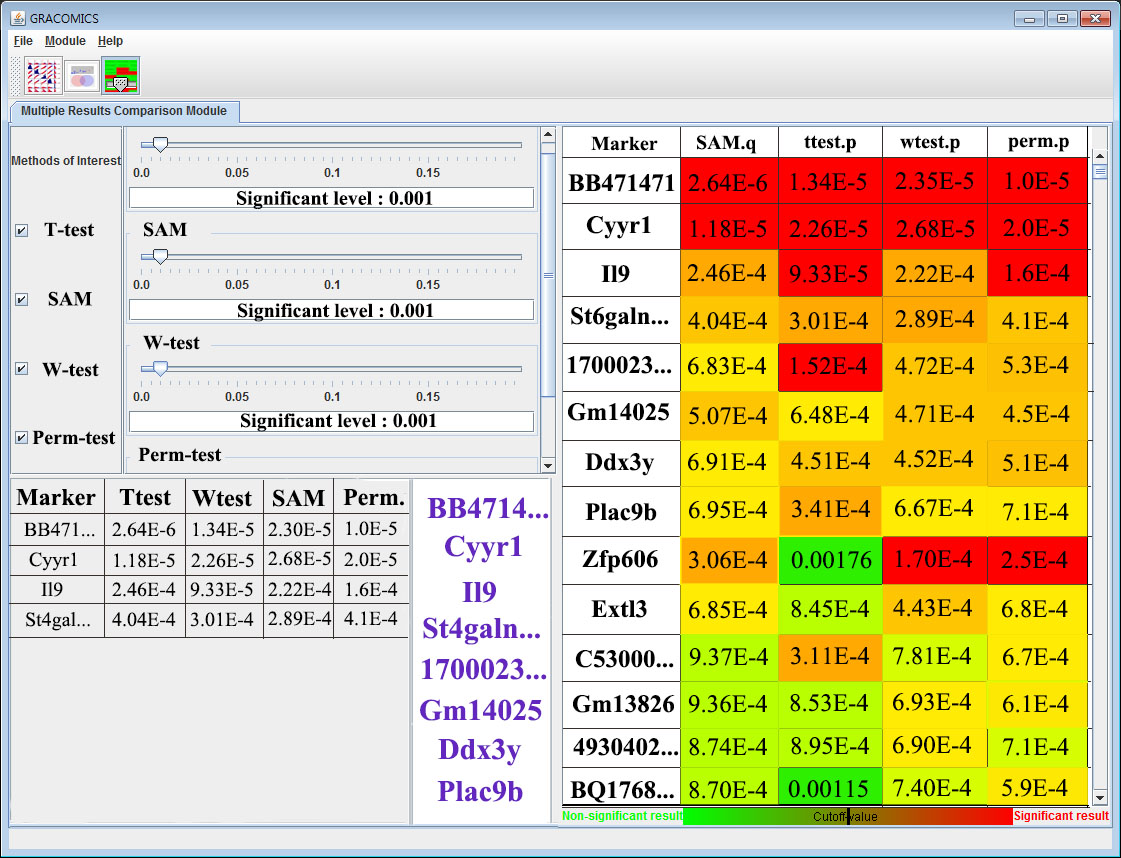
7. Multiple Results Comparison Module (Multi-RC)
So far, Pair-ASP and Pair-DSP were used to compare two statistical methods at a time; however, Multi-RC is a module to compare several methods at once. As shown on figure 7, Multi-RC provides a Heat Map Table comparison of methods at a glance. By using the slide bar to manipulate the cutoffs for each method, the user can change the significant outcomes from independent cutoff values. The figure is a result from a microarray data; significant genes are coded in green and the others are in red, and the results of the heat map are summarized in a table located on the bottom left. This module interactively compares n-number of methods as a whole.