This fold includes R source files for implementation of the numerical study in the manuscript submitted to BMC Genomics, 2016, titled “A novel multifactor dimensionality reduction method based on fuzzy set theory for detecting gene-gene interaction”.
Usage
The following functions are implemented in the source code: mdr.fuzzycv —— Implements Fuzzy MDR with cross-validation mdr.fuzzy —— Performs Fuzzy MDR over a specified set of combinations of variables/loci mdr.fhr ——Estimates the accuracy of an Fuzzy MDR model given high-risk/low-risk status
Example
mdr.fuzzycv(data, K=2, cv=10, ratio = NULL, genotype = c(0,1,2),memb=”linear”,criteria_OR=2,weight=1 ) memb= “original” -> original MDR “linear”-> linear membership “sigmoid”-> sigmoid membership
Download
The above contents including the R code and sample dataset can be download from the below link.
Fuzzy set based approach to generalized multi-factor dimensionality reduction analysis of gene-gene interactions (FGMDR)
Introduction
This method is fuzzy generalized multifactor dimensionality reduction (FGMDR) method as an extension of GMDR method to detect gene-gene interactions associated with disease using fuzzy set theory. Details of Fuzzy MDR is explained in the following paper. More details of FGMDR will be updated as soon as published.
Citation
Jung, H.-Y., et al. (2016) A novel fuzzy set based multifactor dimensionality reduction method for detecting gene-gene interaction, Computational Biology and Chemistry.
Example
#glm fitting for residual calculation with equation as class~covariates form
fit_model <- glm(temp_data[,n]~temp_data[,n-1], data= temp_data, family = binomial(link = "logit"))

#standard residuals for FGMDR
temp_data$res<-residuals(fit_model, type="response")

#data transformation, SNPs(9:24) and residuals(8)
data_FGMDR <- temp_data[,c(9:24, 8)]

#run FGMDR with 2-locus, 0.5 threshold and 10-fold cross validation
res_2_2<-FGMDR(data_FGMDR, 2, 0.5, 10)

#drawing result figure
plot_FMDR(res_2,2)
Download
The above R code be download from the below link. Download
A novel fuzzy set based multifactor dimensionality reduction method for detecting gene-gene interaction (EFMDR)
Introduction
This method is an extension of Fuzzy MDR without tuning parameters. Details of Fuzzy MDR is explained in the following paper. In this EFMDR method, the membership degree is estimated by the maximum likelihood estimator of the proportion of cases(controls) in each genotype combination. More details of EFMDR will be updated as soon as published.
Citation
Jung, H.-Y., et al. (2016) A novel fuzzy set based multifactor dimensionality reduction method for detecting gene-gene interaction, Computational Biology and Chemistry.
Example
# an example of 2-locus analysis using MDR sample data library(MDR) data("mdr1")
res<-EFMDR(mdr1,2)
plot_EFMDR(res,2)
Download
The above R and CPP code be download from the below link.
GRACOMICS : A Graphical Comparison of Multiple results with Omics data
1. Introduction
GRACOMICS is a visualization program to view a set of multiple graphical results at a glance. Recent omics data have extremely a large number of parameters while having a small set of samples, this is also known as NP-problem and running an analysis with such data will return numerous amounts of results in p-dimensions. Additionally, comparing these results may not be simple as many different analysis-specific results are produced. Consequently, the use of computer languages can’t be avoided when performing such analyses. For example, R (reference) can be used to import data, analyze, and visualize certain data, but comparing of those visualized results still remains a problem. In case the user is computer language friendly, such problem can be solved using R. TM4 (reference) is another program for omics data analysis that uses Graphic User interface (GUI) that ease the burden of programming skills yet, still do not provide a good comparison of multiple results. The main hardship in comparing multiple results is that the results are solely dependent on the user-defined values such as the significant-level. However, GRACOMICS solves such problem; it provides a full comparison of multiple results, and is a GUI based program even a novice in computer programmer can use.
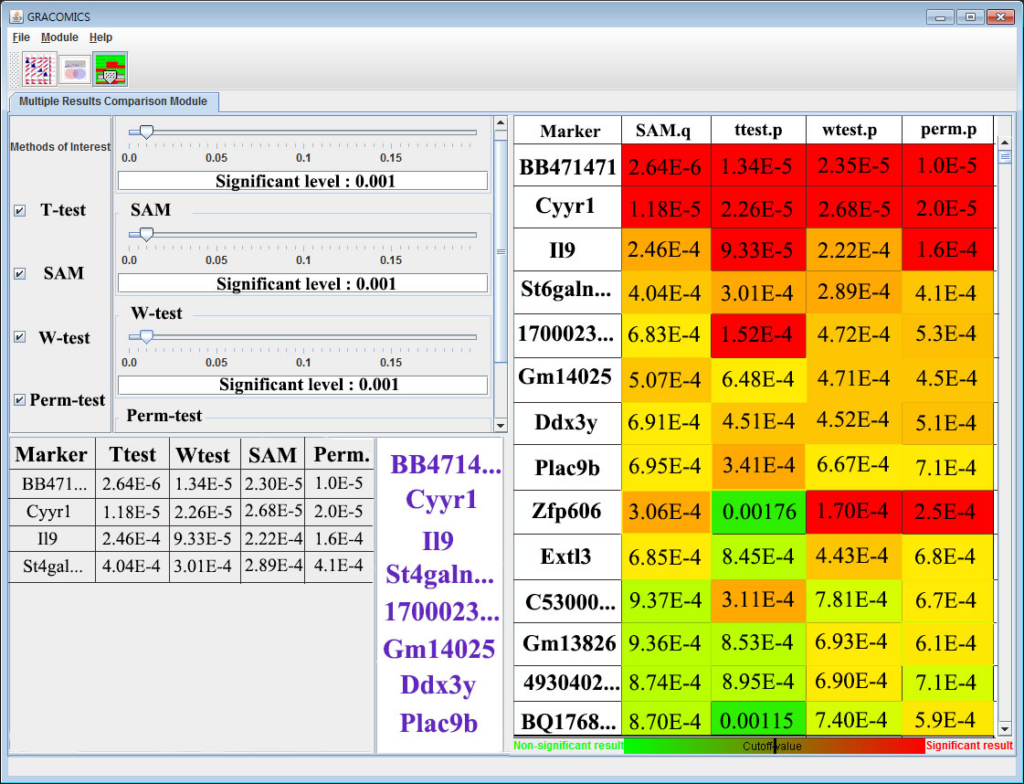
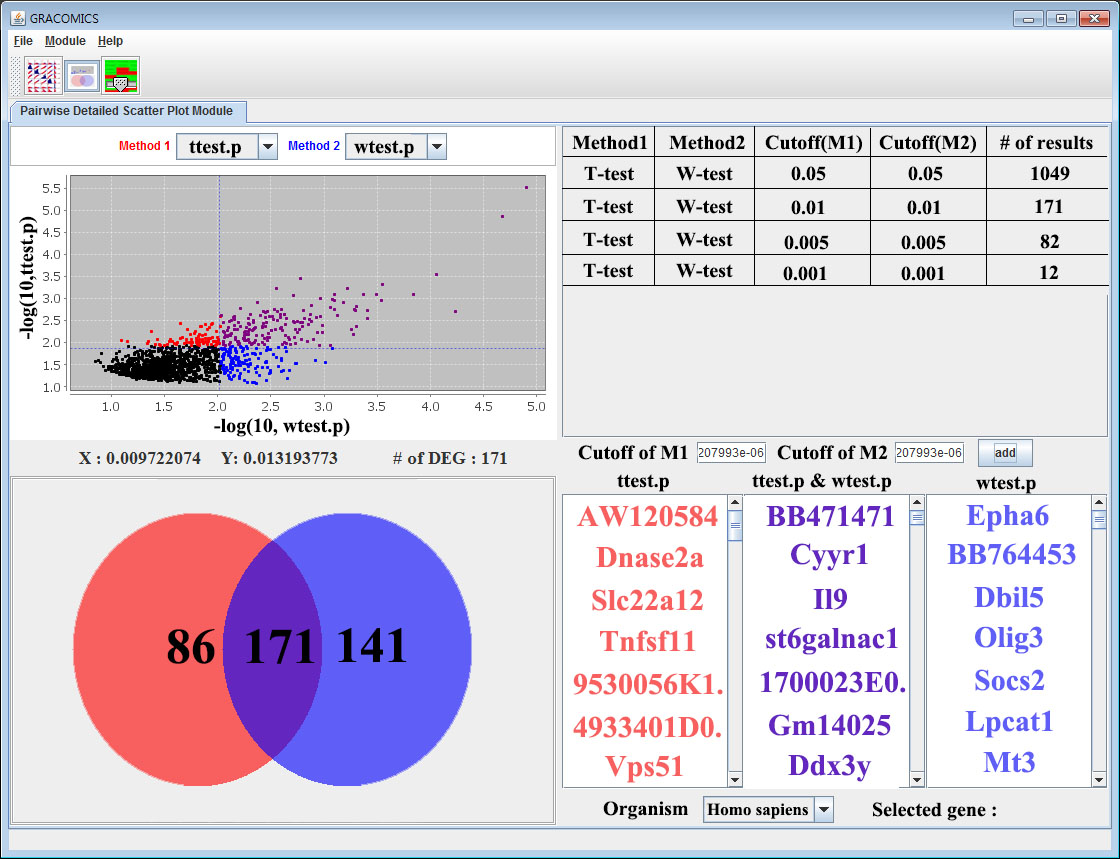
GRACOMICS is composed of 3 modules: Pairwise Correlation Plot to compare two results, Pairwise Interactive Plot to summarize the differences between two results more precisely with a click of a mouse, and Multiple Result Heat Map to compare two or more results comprehensively. Each module is expressed differently, yet can be used to provide mutual supplementation for each other. Especially, as a standalone program, GRACOMICS is a powerful tool that guides novice programmers to effectively compare several analysis results with ease. GRACOMICS is a GUI-based program written in Java for cross-platform computing environment. GRACOMICS can be applied to compare the analysis results for any kind of large scale omics data.
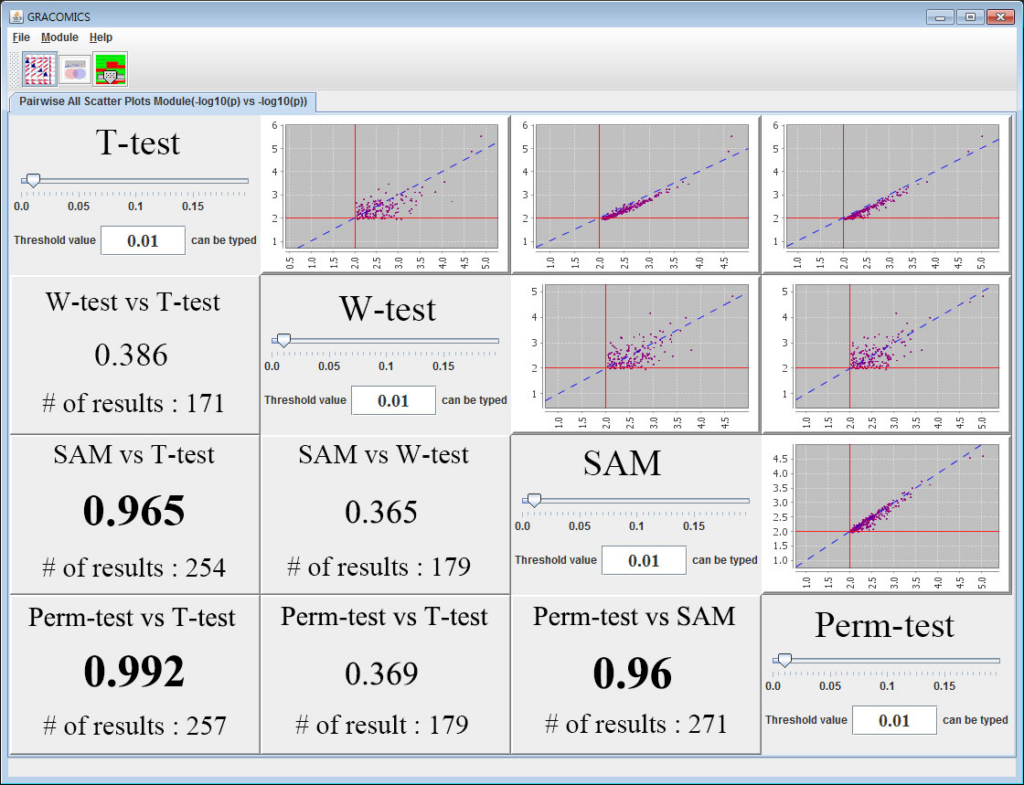
Figure 1: Pairwise All Scatter Plots Module (Pair-ASP)
2. Installation More detailed information is included in the Manual. [ PDF version / Web version ]
Please follow these steps. 1. You can directly download the executable java file(.jar) from the following link: Download the GRACOMICS (.zip) file 2. If you have not installed the java launcher, please download the java launcher from the following link:
JRE (launcher for .jar files) 3. If your OS support the GUI, double click the gracomics.jar, else please input the following command :
Java -jar gracomp.jar
4. When gracomics.jar does not execute in windows, please download and excute the jar-enviroment fixed file following link:Download the jarfix (.exe) file Also, please check the location of GRACOMICS.JAR If GRACOMICS.JAR path includes special letters, please move the file to another path without special letters (i.e. c:\Mr SMITH or c:\Mr_SMITH => c:\MrSMITH)
3. Examples
GRACOMICS can import tab-separated values(TSV) datasets (same as the attached dataset) which are tabular type.
More detalied information is included in the manual.
GRACOMICS has been successfully applied to compare various statistical tests for many omics data such as microarray and SNP data including Welcome Trust Case Control Consortium (WTCCC).
You can get the two dataset to input the GRACOMICS from following link :
