| Contents |
|
- How to prepare user's own input data (SIP format description)
- How to prepare input data from big data repository (TCGA dataset) in user's own preferences
- How to submit a job
- How to interpret results
- Progresses and downloads
- Sample output
- Algorithm description (PATHOME)
|
| How to prepare user's own input data (SIP format description) |
|
|
Below is an example of SIP file.
#Class c1      c1      c2      c2     c2     ...
#NAME  SAMP1   SAMP2   SAMP3   SAMP4  SAMP5  ...
EEF1A1 13.6291 14.5474 14.5837 14.611 14.547 ...
GAPDH  9.12753 11.1789 11.1095 10.040 9.9455 ...
An input SIP file should satisfies the below conditions.
|
| How to submit a job |
|
PATHOME-Drug focuses on human pathogenesis.
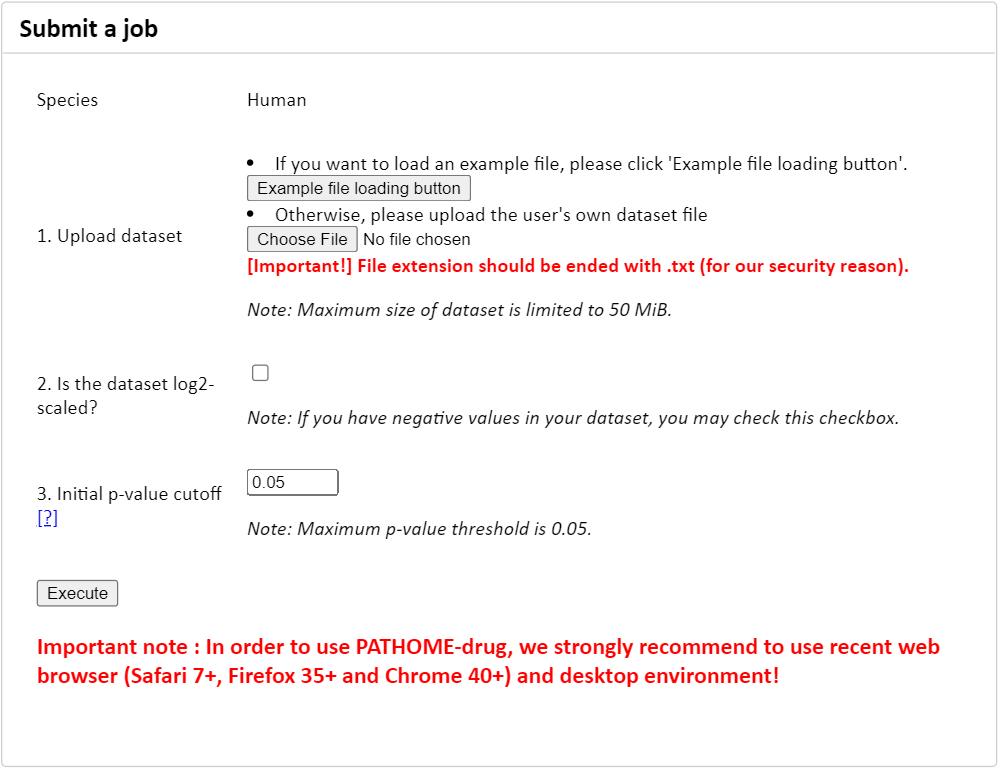
Figure 1. The 'submit a job' panel.
-
Prepare the input dataset according to the following description.
- At least 3 samples per class (group) are mandatory.
- Also, only two classes are considered in the PATHOME-Drug version 1.0.
-
Upload the prepared dataset from your local computer.
- File extension of uploaded dataset must ended with 'txt', due to the security reason of the PATHOME-Drug server.
- In order to maintain performance, maximum size of the uploaded dataset is limited up to 50 MiB.
-
(Optional) Turn on the checkbox '2. Is the dataset log2-scaled?' if the dataset is already log-transformed.
- When user's expressions are count-based or (linear-scaled), please unselect the check box. In the case, PATHOME-Drug allows only non-negative values. If non-negative values are detected, PATHOME-Drug reports an error and stops further processing.
-
Users can change the p-value cutoff.
- The cutoff is used in selecting statistically significant subpathways (see Analysis panel in Figure 5).
- The upper limit of the p-value cutoff was set to 0.05.
- Click 'Execute' button and see the progress.
-
Once the analysis has completed, the visualization and the download will be appeared.
- When there is an error, please report the error with the screenshot and its job ID to the following contact information.
|
| How to interpret results |
|
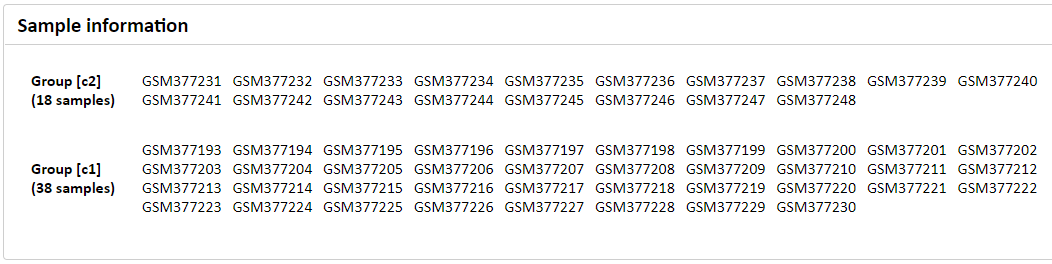
Figure 2. Sample information section using GSE15081.
-
In the 'Sample information' section, sample description is shown.
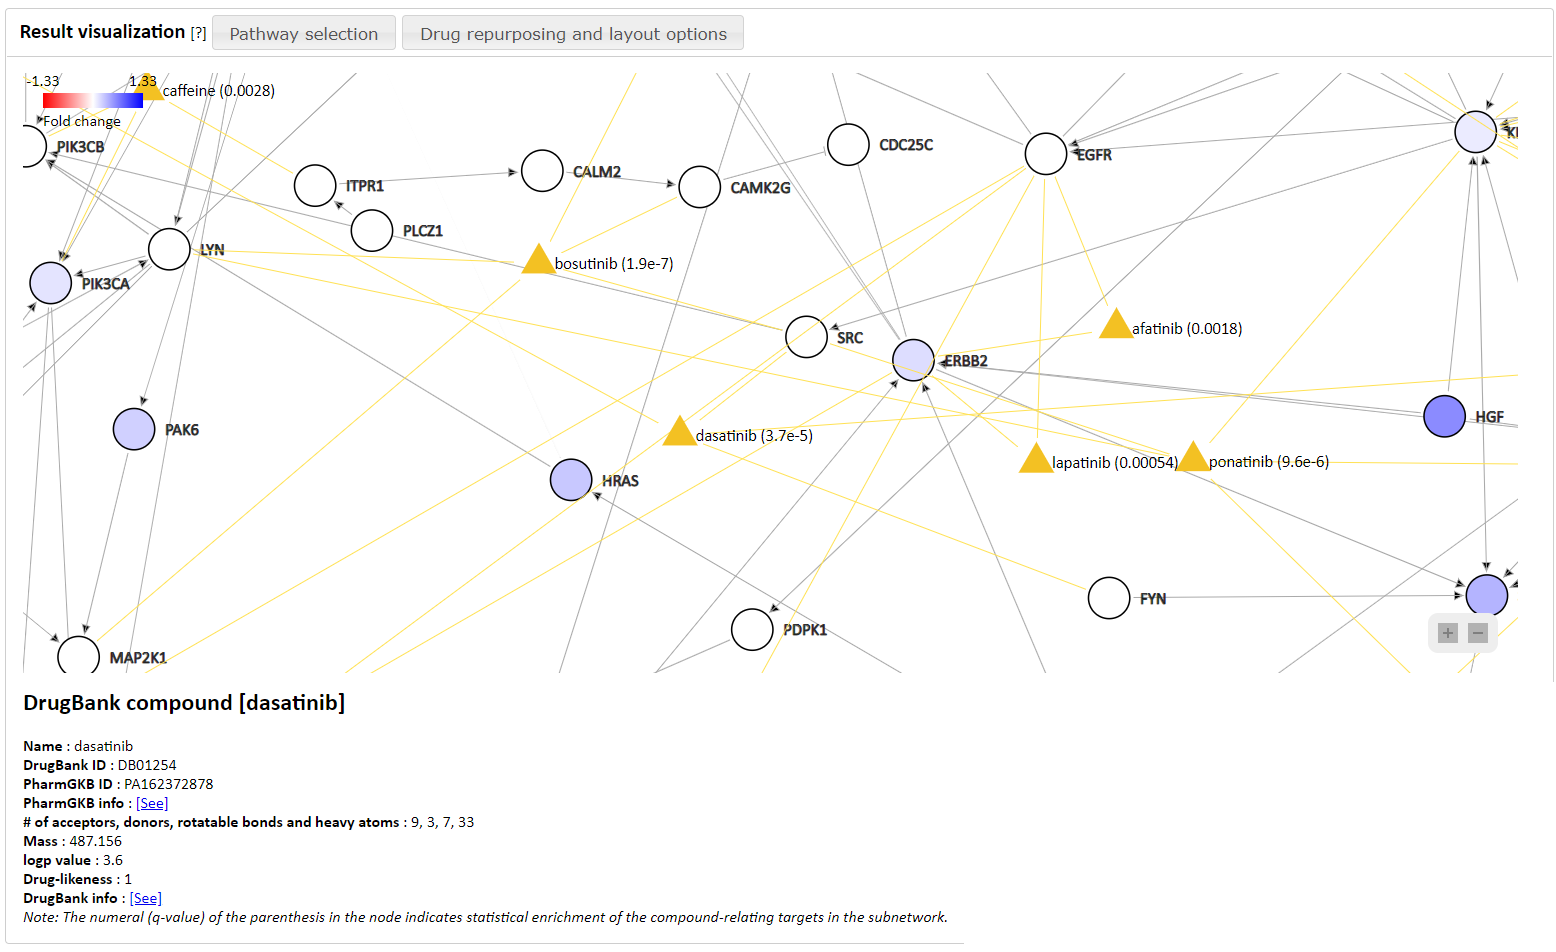
Figure 3. Result visualization section. The result of query from drug dasatinib is presented in the below of
the figure, and
the drug node and its q-value that represents statistical enrichment of the compound-relating
targets in the network is presented in the network.
-
In the 'Result visualization' section, the network that the PATHOME algorithm generated is shown. Also, a control panel in the left gives additional information relating to the network.
- If users click a node, its detailed information is shown in the bottom horizontal panel.
- The additional information provides diseases and drugs associated with the network.
- Users can visualize relationships between the genes in the network and the public databases.
- Currently, one disease-gene relationship database (HGMD) and two drug-gene relationship databases (PharmGKB and DrugBank) are available.
|
| Progresses and downloads |
|
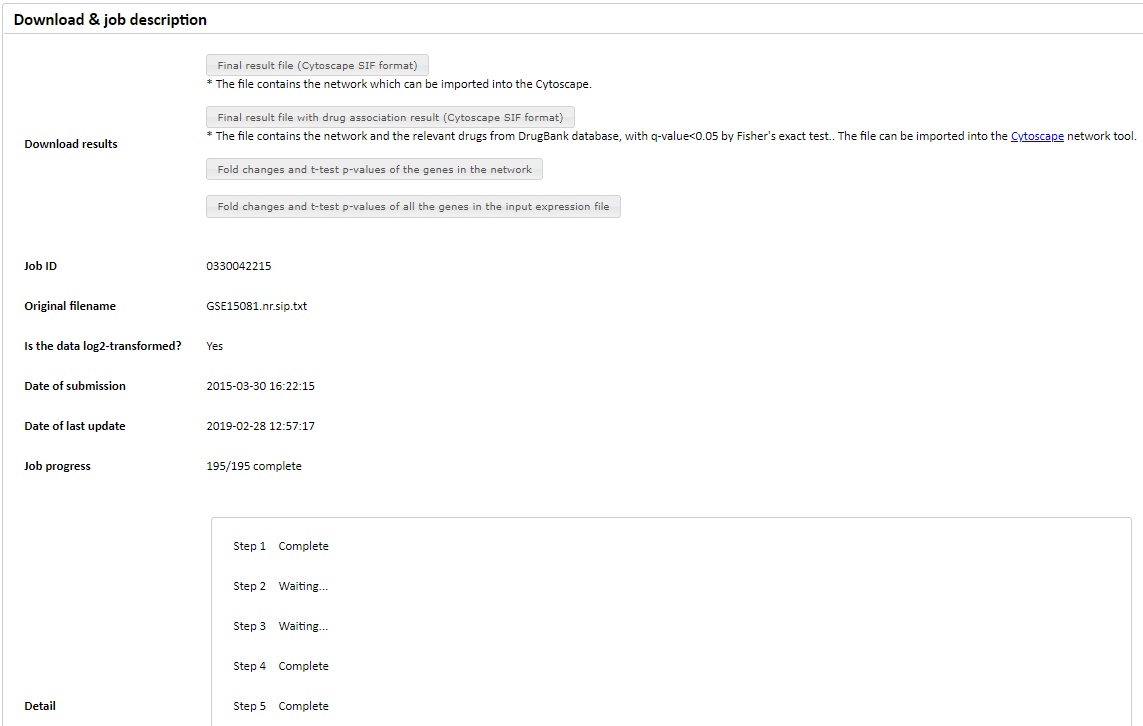
Figure 4. Download and job description section.
In the 'Download & job description' section, we provide files relating to the network. Users can download the following files, and open them in Cytoscape (www.cytoscape.org) for visualization and further work.
In addition to the Cytoscape-related downloads, we also provide a function that exports the list of significant genes, as shown in Figure 4.
|
| Sample output |
|
- Sample input dataset (download)
- The sample dataset is the gastric cancer dataset (GEO accession: GSE15081) with the two groups: c1 (peritoneal relapse, 38 samples) vs. c2 (relapse-free, 18 samples).
- Since his dataset is log2-transformed dataset, there is no need to select '2. Is the dataset log2-scaled?' checkbox when submitting a job using this dataset.
- Sample output
|
| Algorithm description (PATHOME) |
|
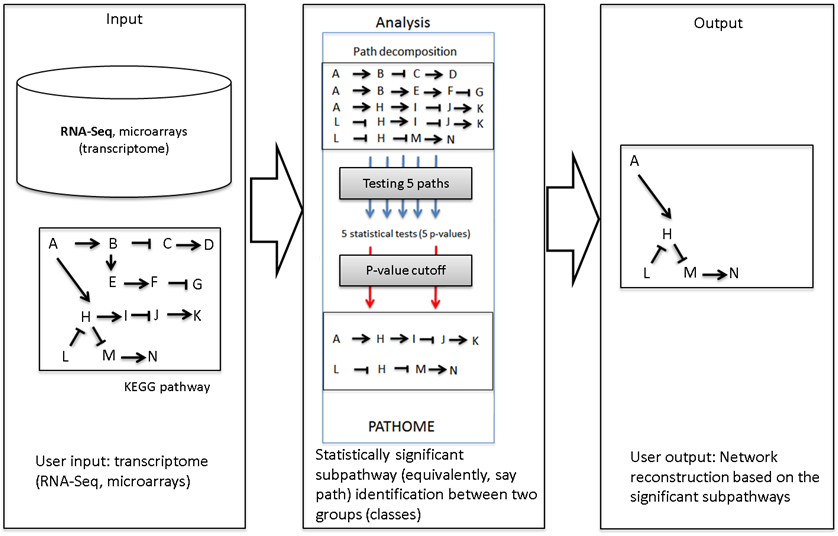
The PATHOME-Drug was implemented using the PATHOME algorithm (Oncogene (2014) 33, 4941-4951) which takes the gene expression profiles of two comparison groups (for example, cancer vs non-cancer tissue) and related biological pathways from prior knowledge. In PATHOME-Drug, the KEGG pathway is used as database for the source of prior knowledge. The PATHOME algorithm first decomposes the pathways into linear paths (subpathways) from the top nodes to leaf nodes, and then employs simple statistical tests to evaluate the significance of differential expression patterns along the subpathways(In the analysis panel of Figure 5). The interaction property (for example, activation or inhibition) between the two adjancent genes is also considered as shown in Figure 6.
|
|
Figure 5. The overview of PATHOME algorithm. PATHOME-Drug implements the algorithm in a web service. This tool aims at narrowing down a prior complex network (e.g., KEGG pathway; see the toy network in Input panel) to its subnetwork (see the subnetwork in Output panel) by using the statistical method described in our previous publication ( Oncogene (2014) 33, 4941-4951). The method considers not only gene expression but also edge between adjacent genes, which is an unique feature in the method. The p-value cutoff option in the submission page is involved in the Analysis panel.
|
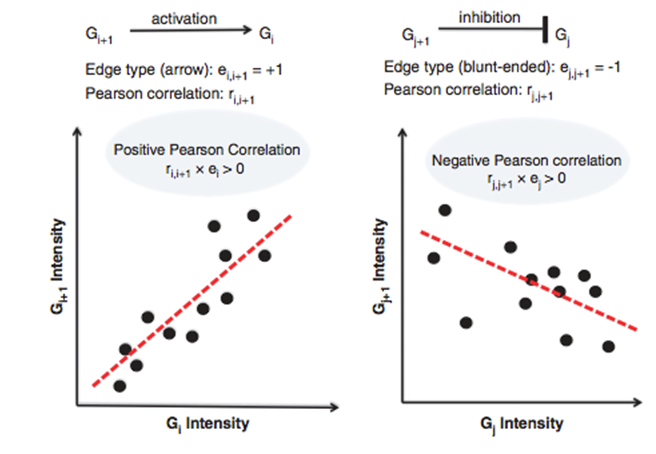
Figure 6. The rule associates regulation (edge) information of adjacent entries with their expressions in terms of the sign information of Pearson product-moment correlation coefficients. The graphical edge type comes from regulation information between the adjacent entries (here, ei,i+1 and ej,j+1 from pairs Gi-Gi+1 and Gj-Gj+1, respectively) from KEGG pathway. The edge type is coded to +1 (activation) or -1 (inhibition) according to its head shape (arrow or blunt-ended). We used the sign information of Pearson correlation product coefficient (here, ri,i+1 and rj,j+1) as an edge type surrogate in the expression data. When the sign information of the coefficient and that of the edge type are the same, we say that the expression and the prior regulation information are agreeable in an experimental group. (The content comes from our publication Oncogene (2014) 33, 4941-4951).
|
|
All rights reserved to BIBS laboratory, Seoul National University, Korea.
|