Step 1. Execution
Step 2. Analyze dataset
Step 3. Advanced running
Step 4. Visualize result
Step 1. Execution
Basically, PHARAOH is a command-line software; i.e., it is NOT possible to run PHARAOH visually or interactive, like graphical user interface.
To provide an information about running PHARAOH, here we describe a short tutorial to run PHARAOH in your desktop or server.
Please proceed to the tutorial by the operating system that PHARAOH is running on.
Microsoft Windows
PHARAOH supports from Windows XP (which is very legacy version of Windows, hence we really not recommend to run PHARAOH on Windows XP, although we supports this version) to Windows 8.1.
In this tutorial, we describe how run the PHARAOH software and do an analysis using PHARAOH.
Step 1: Run command-line interface
The PHARAOH software is command-line software. Hence it is required to run command-line interface to run the PHARAOH software.
Run the command-line interface of Microsoft Windows by the following procedures.
- Type Windows key (
or
or
, depending on your keyboard appearance) + R.
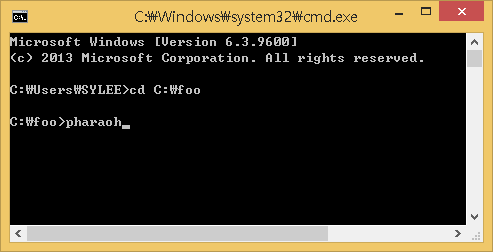
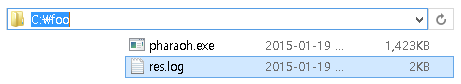
- Type cmd to launch the command-line prompt.After executing the command-line, move to the directory that the PHARAOH program was extracted. Let’s say the directory is C:\foo.
Figure 1. Type cd C:\foo to move the directory.
If there is the PHARAOH program was extracted properly, type the following command will showing proper output and generating one file, res.log.
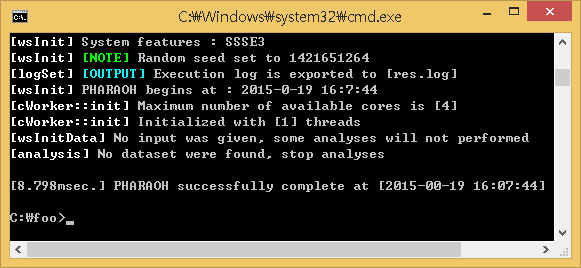
Figure 2. Type pharaoh to execute the PHARAOH program.
Figure 3. When the PHARAOH program has executed properly.
If the above Figure 3 does not shown, it indicates that there was a problem before the preparation of the PHARAOH program. However, unless there was no problem, res.log file will be shown in C:/foo directory.
Figure 4. res.log has created.
The generated log file contains summary of the performed analysis, and helpful information to find out and solve the problem.
Now, the preparation has over, let’s do some analysis using PHARAOH.

Linux distributions
Note 1: In this manual, the command-line interface is assumed.
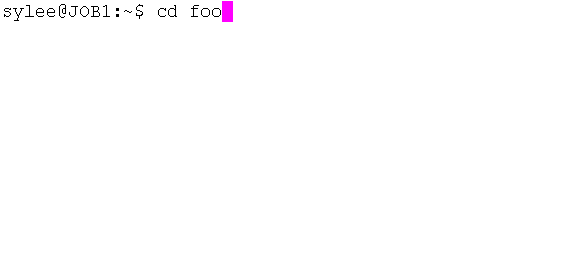
Note 2: An appearance of command-line interface may differ with your one.Let’s start from the initial screen of terminal, and go to the directory where the PHARAOH program was extracted.
Figure 1. Go to the directory of the PHARAOH program
Check whether the PHARAOH program is in the path or not.
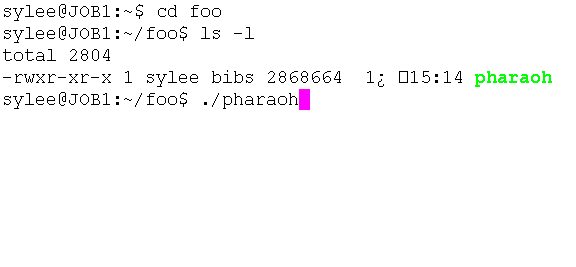
Figure 2. Check and run the PHARAOH program
As shown in Figure 2, there is a file named PHARAOH, and its permission (leftmost part of 4th line) is correct. If the permission is not correct, the program will not be executed.
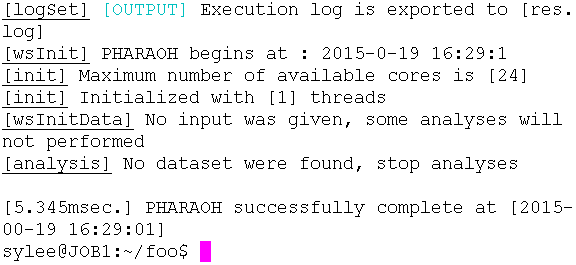
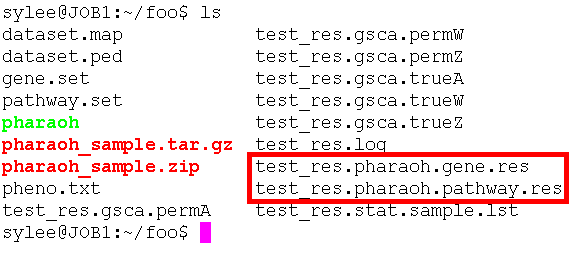
Type ./pharaoh to execute the program. Note that the program will not be executed if the first two characters(dot and slash) are omitted.Figure 3. Successful execution
Figure 4. Check the result file (red box in figure)
Step 2. Analyze dataset
Click to see the contents
The sample dataset can be downloaded from the below links.
pharaoh_sample (zip file)
pharaoh_sample (tar.gz file)
The sample dataset consists of five files: dataset.ped, dataset.map, gene.set, pathway.set and pheno.txt.
| dataset.ped | Contains (1)information of samples and (2)genotypes of the samples. |
| dataset.map | Contains information of genetic variants. |
| gene.set | Contains the mapping between the genetic variants and the gene. |
| pathway.set | Contains the mapping between the genes and the pathway. |
| pheno.txt | Contains the phenotypes and the covariates of the samples. |
Let’s do simplest run using the PHARAOH program.
Preparation
After downloading the sample dataset, it is required to uncompress the downloaded files to the directory where the PHARAOH program was extracted.
Note: For Microsoft Windows, we strongly recommend to use other GUI-based archive software, such as BandiZip.
The following commands for Linux distributions will extract the sample dataset into the directory where the zipped file exists.
# For Linux distributions (zip)
pharaoh@JOB1:~/foo$ unzip pharaoh_sample.zip

# For Linux distributions (tar.gz)
pharaoh@JOB1:~/foo$ tar xvfz pharaoh_sample.tar.gz
Full-automatic running
In full-automatic mode, only two parameters that PHARAOH requires are
- (--cv) Number of cross-validations to perform to determine an optimal lambda(λ) value.
- (--nperm) Number of permutations to get the p-values. In default, 1000 is recommended value.
In this mode, the PHARAOH program first determines an optimal value of λ via cross-validation, and next run PHARAOH analysis.
# For Linux distributions
pharaoh@JOB1:~/foo$ ./pharaoh --pharaoh --cv 2 --nperm 1000 --ped dataset.ped --set gene.set --geneset pathway.set --out test_res

# For Microsoft Windows
C:\foo> pharaoh --pharaoh --cv 2 --nperm 1000 --ped dataset.ped --set gene.set --geneset pathway.set --out test_res
--pharaoh command let the PHARAOH program performs PHARAOH analysis.
--cv and --nperm are the parameter that are required to perform PHARAOH analysis.
--ped, --set and --geneset indicate the dataset, variants-gene mapping and genes-pathway mapping, respectively.
--out determines the prefix of results.
Results
The PHARAOH program generates the following files after the normal run.
[prefix].pharaoh.pathway.res The main result file. [prefix].pharaoh.gene.res The gene-level result file. The details of the output files are as follows.
Note that the columns with red color should be focused on the interpretation.
[prefix].pharaoh.pathway.res Column name Description PATHWAY Name of pathway NPERM Number of performed permutations NGENE Number of genes included in the pathway NVARIANT Total number of collapsed rare variants in the pathway P_PHARAOH Permutation p-value of the pathway
[prefix].pharaoh.gene.res Column name Description PATHWAY The pathway name that the gene is included GENE Name of gene NPERM Number of genes included in the pathway NVARIANT Total number of collapsed rare variants in the gene P_PHARAOH_GENE_LOCAL p-value of the gene computed within the pathway P_PHARAOH_GENE_MARGINAL p-value of the gene computed marginally
Step 3. Advanced running
Click to see the contents
Fix ridge penalty value λ
If there is a known value of ridge penalty or is required to fine-grained tuning of the result, a fixed penalty value λ can be used.
- (--prolambda) Pre-determined lambda(λ) value. --cv option will not required if use this option.
The following example demonstrates usage of fixed penalty value λ.
# For Linux distributions
pharaoh@JOB1:~/foo$ ./pharaoh --pharaoh --prolambda 155 --ped dataset.ped --set gene.set --geneset pathway.set

# For Microsoft Windows
C:\foo> pharaoh --pharaoh --prolambda 155 --ped dataset.ped --set gene.set --geneset pathway.set
--pharaoh command let the PHARAOH program performs PHARAOH analysis.
--prolambda fixes the λ parameter.
--ped, --set and --geneset indicate the dataset, variants-gene mapping and genes-pathway mapping, respectively.
Apply user-defined weight on genetic variants
Recent advancement in bioinformatics allows multiple strategy on variant collapsing with various bioinformatics resources, such as predicted effect on protein structure. For this case, users can allow user-defined weight on genetic variants using PHARAOH, with the below command.
# For Linux distributions
pharaoh@JOB1:~/foo$ ./pharaoh --pharaoh --weight weight.txt --ped dataset.ped --set gene.set --geneset pathway.set

# For Microsoft Windows
C:\foo> pharaoh --pharaoh --weight weight.txt --ped dataset.ped --set gene.set --geneset pathway.set
--pharaoh command let the PHARAOH program performs PHARAOH analysis.
--weight assigns user-defined weight on the variants, as a file consists of two columns.
In the file, the first column indicates the variant, and the second column contains “user-defined weight” when collapsing variants into the gene.
--ped, --set and --geneset indicate the dataset, variants-gene mapping and genes-pathway mapping, respectively.
Step 4. Visualize result
Click to see the contents
Retrieve the result via R
The main result file, [prefix].pharaoh.pathway.res, can be retrieved directly into using its basic function, read.table(). Refer the following R code.
In this guide, we assumed that the following required packages have already installed.
- igraph : For layout and graph drawing
- devEMF : To export the figures in EMF format. This format shows great editability in Office softwares.
- gap : For quantile-quantile plot drawing
In addition, it will be required to download the visualization script and move the downloaded script to the working directory.
# Load required package
library(igraph)
library(devEMF) # Comment this line to export the figure in high-resolution TIFF
library(gap)
# Set the working directory
setwd("C:/foo")
# Load visualization script
source("pharaoh_summary.r")
# Visuaize result
pharaoh.summary("test_res", # The prefix of results is 'test_res'
  "myPheno",     # The tested phenotype name is 'myPheno'
  "myPathwayDB", # The pathway database used is 'myPathwayDB'
  ppathway=0.5,  # Plot only pathways with its p-value < 0.5
  pgene=0.5,     # Plot only genes with its p-value < 0.5 and its included pathways' p-value < 0.5
  eprop=0.5      # Make text bigger than the default
  )
The above command will generate two files with .emf (.tif without devEMF package) extension, which can be directly edited from Microsoft Office program.
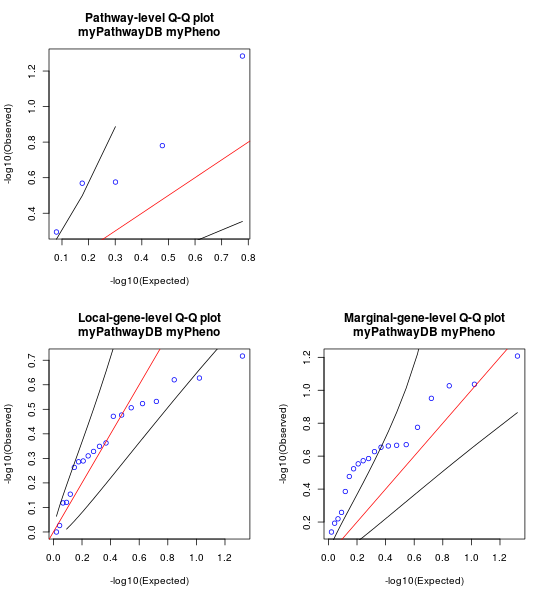
Figure 1. Quantile-quantile (QQ) plot generated by the R script.
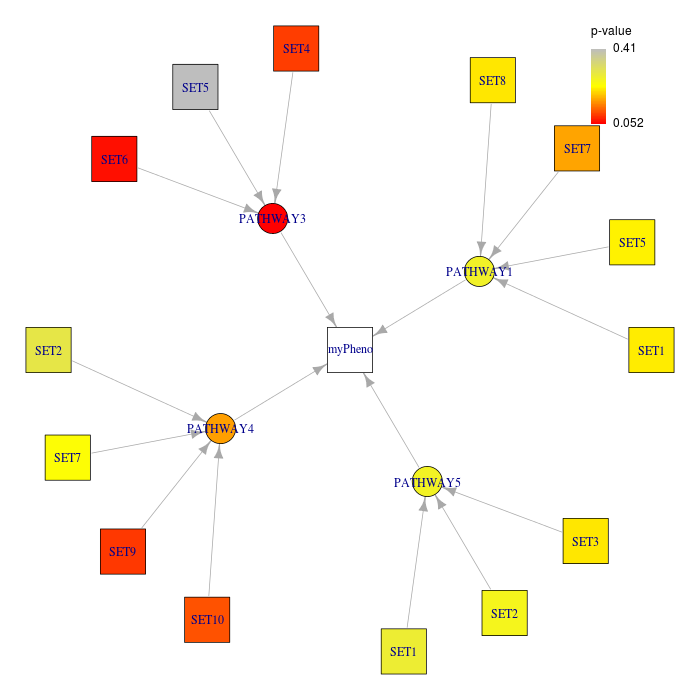
Figure 2. Summary plot generated by the R script.
The first figure generated by the R script is quantile-quantile (QQ) plot. Generally, it can be said that there is no obvious inflation or deflation if the dots in the plot placed within the two black lines in the plot. Note that if the number of dots(=the number of pathways/genes tested) is too small, the placement of dots can be unstable.
The second figure summarizes significant pathways and genes under each given p-value thresholds (ppathway and pgene). From this figure, significant pathways and its significant genes can easily summarized. Only the significant genes under significant pathways will be drawn. The colors which are corresponding to the legend indicate the p-value of the node.
If no gene or pathway is significant (i.e., no gene p-value under pgene or no pathway p-value under ppathway), the function will fail and no output will be generated.